Payment Orchestration Won't Tell You Which Processor Fails You
Orchestration routes payments. It does not tell you which processor is quietly costing you money. Here is how to measure processor performance like-for-like, after fees, chargebacks and refunds.
Two orchestration announcements landed in late July 2026, three weeks apart. The trade press covered both the same way. Wizlo picked Gr4vy for processor-independent orchestration, connecting Stripe, Adyen, Authorize.Net and Google Pay through one integration. Juspay and Recurly integrated Hyperswitch into Recurly's subscription billing, opening access to over 300 payment service providers (PSPs) and acquirers. Every outlet covered the routing layer. Nobody asked the question a chief financial officer asks the morning after. Traffic now splits across four processors, so which one is quietly costing us money?
That question has no answer inside the orchestration layer. It is not a product gap anyone is hiding. It is structural. Orchestration decides where a transaction goes. Measurement decides what happened and why. This post covers three things: what orchestration does, what it structurally cannot answer, and how to compare processors like-for-like without fooling yourself.
What does payment orchestration actually do?
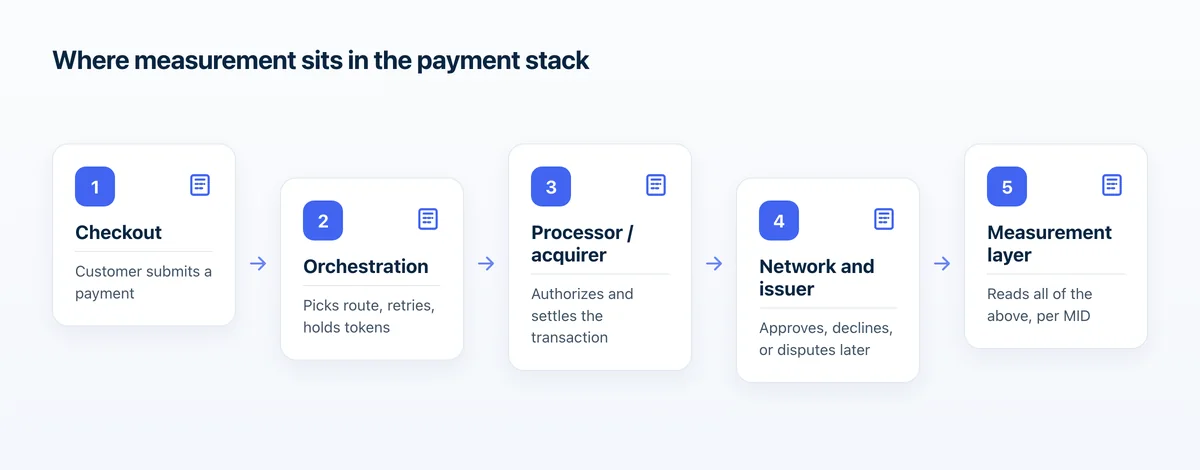
Payment orchestration is a technology layer. It connects a merchant to multiple PSPs, acquirers and payment methods through a single integration. It routes each transaction to the option most likely to serve it best. It sits between checkout and processors, and it does not process transactions itself. Its four core jobs are routing, retries and fallback, provider-agnostic tokenization, and consolidated reporting.
The three layers are distinct, and the vendor explainers on page one of Google blur them. A payment processor is the technical engine that communicates with card networks and issuing banks to authorize and settle transactions. A gateway passes the transaction to that engine. Orchestration sits above both and decides which engine each transaction reaches. Orchestration does not replace or compete with processors. Processors still execute transactions and connect merchants to acquiring infrastructure. Our payment orchestration primer walks the full stack.
Why can't orchestration tell you which processor is failing you?
Orchestration answers a decline by re-routing, not by diagnosing. It retries through an alternative provider or applies fallback logic, which is exactly its job. But the system records a transaction that succeeds on the second processor as a success. The retry absorbs the quiet degradation on the first processor instead of surfacing it as a signal.
A second, harder problem sits underneath. Primer is an orchestration vendor. It states that without standardized decline codes or unified reporting logic it is hard to compare performance across providers or trust the insights. Primer also concedes that adding providers makes payment data more fragmented, not less. Each PSP reports outcomes in its own vocabulary: different status models, error codes, identifiers and async rules.
Decline codes make this concrete. Alphanumeric decline codes are proprietary to the processor or gateway that issued them. Two merchants on different processors can therefore receive the same code for entirely different underlying reasons. Code "00" means approved on some gateways and "Issuer System Unavailable" on others, which use "11" for approval. Merchant Advice Codes (MACs), which tell a merchant what to do after a decline, are not universally supported either. The same decline can carry a usable MAC on one processor and none on another, and that gap alone looks like a performance difference.
How do I tell which processor is causing the most damage?
Start from your own transaction data, not from any processor's dashboard. Rank processors by money lost rather than by approval rate. Damage has four parts. Count declined revenue you could have recovered, plus retry and scheme fees you are paying. Add chargebacks and refunds net of fees, plus compliance exposure per MID. Then verify the ranking with a randomized traffic split.
Rank on money rather than rate, because the two diverge. Gr4vy argues the key metric is cost per successful transaction rather than blended processing fees. Gr4vy also argues that merchants should compare providers on net revenue rather than advertised pricing, including interchange, scheme fees, authentication costs and fraud losses. A processor with a flattering headline rate that buys it with retries is not the winner.
- Normalize first. Keep the raw decline code alongside a normalized interpretation, because provider mappings can change without notice. Most gateways display the processor's mapped code next to the raw two-digit issuer response, and it is the standard issuer code that tells you what happened.
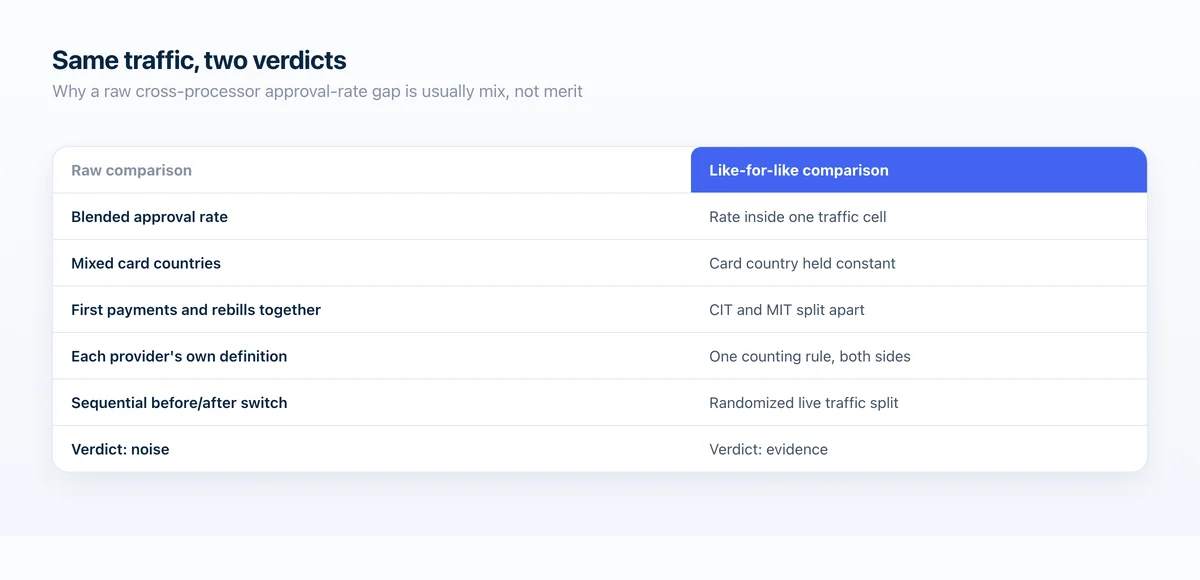
- Segment before you compare. Hold card country, charge type (first payment versus rebill) and issuer constant. Anything else is a mix comparison wearing a performance costume.
- Price the retries. Failed transactions never appear in the settlement file, so retry fees surface as a month-end lump sum rather than at transaction level. Pull them back to the processor that generated them.
- Add the dispute and refund tail. Chargebacks and refunds land weeks after the authorization and belong to the processor that took the sale.
- Split traffic randomly to confirm. Comparing a processor's numbers before and after a switch cannot isolate the processor's effect, because seasonality, economic shifts and customer-behaviour changes move at the same time.
Sample size decides whether you can declare a winner at all. Detecting a shift from 70% to 80% needs about 330 payments per variant. Detecting 70% to 71% needs 33,000 per variant. Most merchants calling a processor "worse" on a one-point gap do not have the volume to support the claim. They are reading noise as signal. Our guide to diagnosing an approval-rate drop covers the triage order.
Why is my approval rate dropping on one processor but not others?
Two causes explain most of it. The router sends that processor a different, harder slice of traffic, or the issuer relationship behind its acquiring route has changed. Gr4vy notes that large swings between regions or providers usually indicate traffic is not flowing through optimal paths. A raw gap is therefore a routing and mix signal first, and a processor-quality signal only after you rule the mix out.
Check the most common real causes in this order. Card country mix shifted. Charge-type mix shifted. Tokenization coverage differs. Issuer behaviour changed. Or the merchant category code (MCC) on that MID is misaligned. That last one is quietly fatal. A misaligned MCC makes issuers score every billing attempt against the wrong risk model. That creates a systematic approval ceiling that no routing or retry change can lift. Two MIDs on two processors with different MCCs are not comparable at all.
Partial degradation is the hardest version of this, because provider-level averages hide it. A failure confined to one segment disappears inside a provider-wide approval rate. Revenue-losing payment failures escape infrastructure monitoring too: authorization rates can fall while every server metric looks healthy. That is the mechanism behind "quietly costing you money".
Why comparing approval rates across processors is usually wrong
Each processor sees different traffic, and the traffic differences are larger than the processor differences. A cross-processor approval-rate comparison is only valid inside a fixed cell of card country, charge type and issuer. Outside that cell you measure the router's decisions, not the processors' competence.
Charge type matters just as much. Initial authorization rates run 80 to 85%, while recurring authorization rates run 90 to 95%. The card networks assign different characteristics and requirements based on whether a transaction is customer-initiated or merchant-initiated. In subscription businesses, soft declines make up 70 to 90% of all declines, a very different mix from first-payment traffic. Alternative payment methods can underperform traditional methods significantly for merchant-initiated rebills, and Pagos puts that gap above 50%.
The definitional trap sits on top of the mix trap
Even with a perfectly matched traffic cell, the metric itself is not standardized. Gross authorization rate counts every attempt sent to the issuer, so four attempts before an approval count as four. Net counts whether the order was eventually authorized. One transaction that fails three times and succeeds on the fourth is a 100% net rate and a 25% gross rate. Even two "gross" rates fail to line up, because some providers exclude transactions their own fraud tools blocked before the issuer ever saw them. Checkout.com concedes in its own guide that the definition of acceptance rate varies by who you ask.
| Confound | Typical size of effect | Why it is not a processor-quality signal |
|---|---|---|
| Card country (domestic vs cross-border) | 5 to 15 points, up to 10 to 13 on recurring | Issuers scrutinize unfamiliar acquiring routes; the router chose the route |
| Charge type (first payment vs rebill) | Initial 80 to 85% vs recurring 90 to 95% | CIT and MIT are different network categories with different requirements |
| Metric definition (gross vs net) | 6.5 points in Adyen's worked example | Measures retry volume, not authorization skill |
| Retry deduplication convention | 33.3% vs 100% on identical outcomes | Same events, two counting rules |
| Card type (credit / debit / prepaid) | Fixed order: credit beats debit beats prepaid | A processor routed more debit or prepaid shows a worse raw rate |
| Tokenization coverage | Visa claims 4.6% CNP uplift (FY22 data); Mastercard claims 2.1% | Token-heavy and PAN-heavy processors are not like-for-like |
| Payment-method mix | 94% blended can hide 81% Visa credit and 74% on foreign issuers | The blend hides exactly the segment leaking money |
Every row here can be larger than a genuine difference between two competent processors. Hold them constant before you conclude anything.
What does true profitability per processor look like after fees, chargebacks and refunds?
True profitability per processor starts with settled revenue. Subtract processing fees, retry and scheme penalties, and chargebacks with their fees. Subtract refunds, which do not return the original processing fee. Subtract any monitoring-program assessments attributable to that MID. Approval rate is an input to that number, not a substitute for it. The costs also land on a different timetable from the sale.
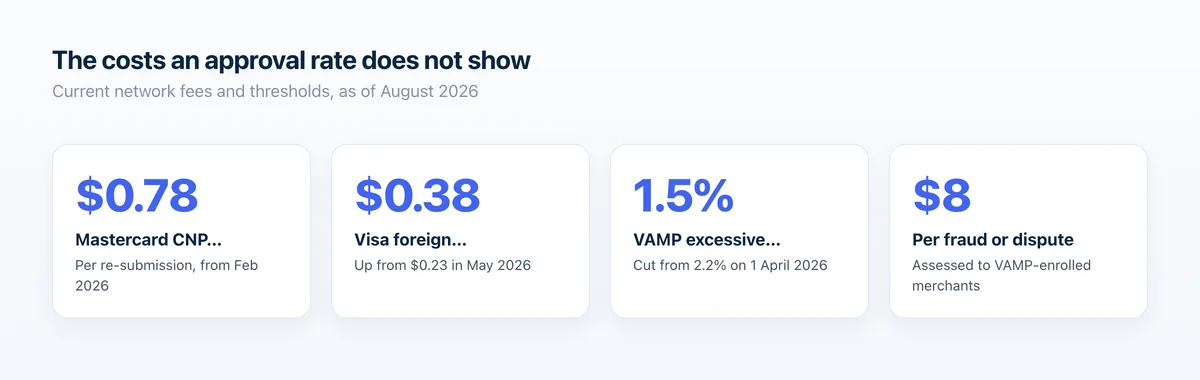
Most merchants have never attributed the retry line. Card-network fees on retries have moved sharply and recently. Mastercard's CNP Advice Decline Fee jumped from $0.05 to $0.78 per re-submission effective 1 February 2026 on TD's published Canadian schedule, about a 15x increase. Mastercard charges it for every re-submission of a decline advice code on the same card within 30 days. Visa's Foreign Compliance Integrity Fee rose from $0.23 to $0.38 per transaction on 1 May 2026. Visa's domestic Compliance Integrity Fee is $0.15, triggered at 20 or more failed attempts on the same card within 30 days. Mastercard's Compliance Integrity Fee is $0.74, triggered by 10 unsuccessful attempts on the same card within 24 hours. Two networks run two different clocks.
An approval rate cannot show any of this, and structurally never will. Failed transactions never appear in the settlement file, so retry fees surface as a month-end lump sum instead of at transaction level. Adyen puts the baseline cost of a retry attempt at about $0.04 regardless of outcome. Ten retries to land one sale therefore cost $0.40 before any penalty. A processor that props up its net approval rate with blind retries generates a large separate line item. You will not see that item in the number you are judging it by.
The dispute tail comes next. ClearSale, citing Mastercard 2025 data, reports processor chargeback fees of $20 to $50 per dispute. All-in merchant costs average $110 per chargeback once merchandise, fulfilment and labour are counted. Refunds carry their own drag. Stripe does not return the original processing fee when a payment is refunded. Mastercard now requires merchants to submit refunds for authorization within 24 hours of notifying the buyer, and issuers can decline those return authorizations. A refund is now a transaction that can fail.
- Settled revenue, per gateway and MID, not blended across the portfolio
- Processing and scheme fees, including interchange and authentication costs
- Retry cost: baseline attempt cost plus Visa and Mastercard compliance/decline-advice fees attributed to the processor that generated the attempts
- Chargebacks at the all-in cost, not just the processor's dispute fee
- Refunds, including the processing fee that does not come back and any declined return authorizations
- Monitoring-program assessments, including the $8 per fraud or disputed transaction charged to merchants enrolled in VAMP
- Reserve holds and rolling reserves held against that MID
- Cost per successful transaction as the summary metric, replacing blended fee rate
How do you monitor MID health across multiple gateways?
Measure disputes per MID, per acquirer, per month, against each network's current thresholds. A blended portfolio dispute rate is useless here. Visa assesses its Acquirer Monitoring Program (VAMP) at the merchant or MID level, not the company level. Mastercard assesses its Excessive Chargeback Merchant program (ECM) the same way. One breaching MID hides inside a healthy-looking blended number, and that is the failure mode to prevent.
These numbers moved this year. Visa's VAMP "excessive" merchant threshold dropped from 2.2% to 1.5% effective 1 April 2026. Acquirer thresholds sit far lower, at 0.5% "above standard" and 0.7% "excessive". Above-standard enforcement began 1 January 2026. Visa assesses merchants enrolled in VAMP $8 per fraud or disputed transaction. First-time violations within a rolling twelve-month period qualify for a three-month grace period.
The mechanics matter more than the headline number. Visa calculates the VAMP ratio as fraud reports (TC40) plus dispute records (TC15), divided by settled transactions (TC05). The ratio counts card-not-present activity only. Because the denominator is settled volume, a processor with a lower approval rate mechanically produces a higher VAMP ratio on identical dispute volume. Your compliance number and your approval number are coupled, per MID. A volume floor also applies. Merchants need at least 1,500 combined fraud and disputes monthly in AP (Asia Pacific), Canada, EU and the U.S. Below that floor, Visa does not capture them. A low-volume MID can therefore run hot without tripping the program, while still poisoning your acquirer's portfolio ratio.
Mastercard runs a separate clock. ECM triggers at a minimum of 100 chargebacks in a calendar month and a monthly chargeback-to-transaction ratio of 1.50%. Mastercard's High Excessive Chargeback Merchant program (HECM) triggers at 300 chargebacks and 3.00%. The ratio uses a lagged denominator: this month's chargebacks over the preceding month's sales at that merchant location. Shifting volume between processors therefore moves the ratio a month before the disputes catch up. Exiting requires the MID to stay below threshold for three consecutive months. See MID health and approval rates for the operational cadence.
Which layer should own which metric?
The routing layer should own where traffic goes and how it retries. The measurement layer should own what happened, why, and what it cost across every acquirer you run, per processor and per MID. Keeping them separate is not a vendor preference. An orchestrator's own engineering guidance concedes that routing is the most visible feature of orchestration. The same guidance calls operational visibility a separate and equally important capability.
| Metric | Owned by | Why |
|---|---|---|
| Route selection and failover | Orchestration | Only the router knows the available paths and rules |
| Retry cascade and timing | Orchestration | Retries execute at the routing layer, within network rules |
| Token vault and portability | Orchestration | Processor-independent tokens are the point of the layer |
| Approval rate by card country, charge type and issuer | Measurement | Needs merchant-side data across all processors, normalized |
| Decline-code analysis (raw plus normalized) | Measurement | Codes are proprietary per processor; mappings change silently |
| Cost per successful transaction | Measurement | Requires fees, retry penalties, refunds and disputes joined to the sale |
| Per-MID VAMP and ECM exposure | Measurement | Assessed per merchant and MID, on a schedule the router cannot see |
| Dispute deflection and representment | Measurement / alerts | Prevention alerts and evidence live outside the routing decision |
One rule of thumb: if the question starts with "where should this go", it is orchestration. If it starts with "what happened and what did it cost", it is measurement.
This is where Beast Insights sits. It is not an orchestrator and not a processor. It is the measurement layer beneath both. It provides decline and approval-rate analytics broken down by decline code, issuer, BIN, gateway/MID and billing cycle. It shows routing and approval performance signal per acquirer and MID. MID Performance shows how disputes and fraud push each gateway toward Visa VAMP and Mastercard thresholds. It reports chargebacks and refunds by dimension. Dashboard figures in any demo are illustrative, never a customer's result.
Frequently Asked Questions
What is payment orchestration?
Payment orchestration is a technology layer that connects a merchant to multiple PSPs, acquirers and payment methods through a single integration and routes each transaction to the option most likely to serve it best. It sits between checkout and processors and does not process transactions itself. Its core functions are routing, retries and fallback, provider-agnostic tokenization and consolidated reporting.
Is payment orchestration worth it?
It is worth it if your problem is connectivity, failover or processor lock-in, and 451 Research found multiprocessor preference grew from 50% in 2023 to 62% in 2025. It is not worth it if your problem is diagnosis, because orchestration re-routes around a failing processor rather than telling you which one is degrading and what it costs you.
How do I know which payment processor is best?
Compare processors inside a fixed cell of card country, charge type and issuer, then confirm with a randomly split traffic test. Solidgate notes every acquirer has different approval rates by issuer, geography and card type, so which processor "wins" depends largely on which slice of traffic it is routed. Rank on cost per successful transaction, not headline approval rate.
Why is my approval rate dropping on one processor but not others?
Most often because that processor is receiving a different traffic mix, not because it got worse. Gr4vy notes large swings between providers usually indicate traffic is not flowing through optimal paths. Check card country mix, first-payment versus rebill mix, tokenization coverage and MCC alignment on that MID before concluding the processor is at fault.
Can payment orchestration improve authorization rates?
Vendors publish claims that it does, and those should be read as vendor claims. Gr4vy publishes a case study claiming Australian retailer Baby Bunting saw a 2.8% authorization-rate uplift within four months on an orchestrated dual-acquirer setup with failover routing. Gr4vy also states merchants using multiple PSPs outperform single-provider merchants only "when benchmarks are applied correctly".
What should I look for in a payment analytics platform for merchants running multiple processors?
The right platform is one that sits beneath your processors rather than inside one of them, since Stripe's own docs confirm a processor cannot compute an authorization rate for a non-Stripe processor. Look for normalized decline codes with raw codes retained, segmentation by card country, charge type, issuer and BIN, per-MID dispute thresholds, and cost per successful transaction.