What Tools Track Payment Profitability Across Processors?
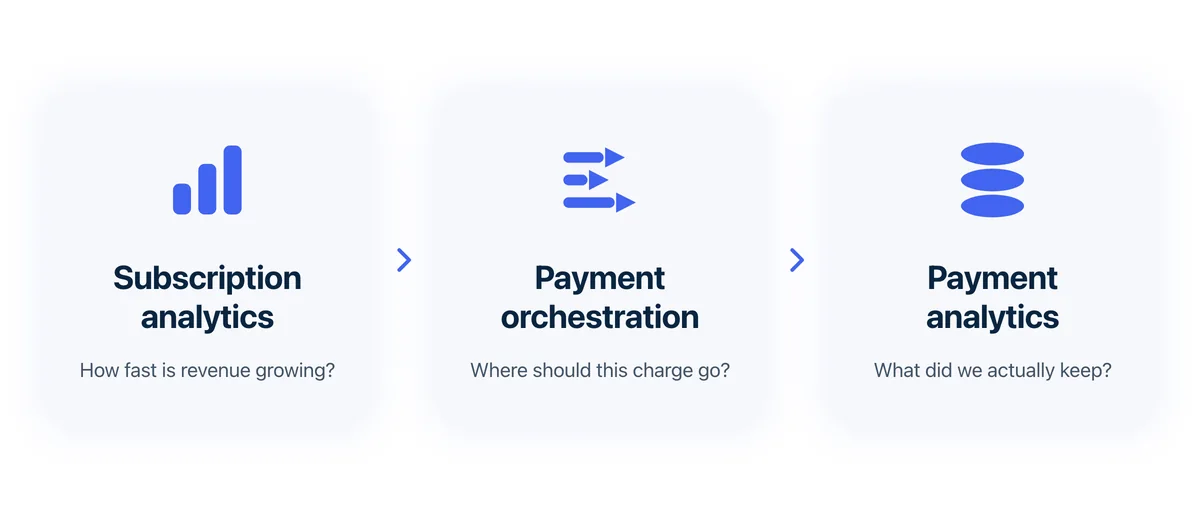
Subscription analytics tools measure revenue. Payment orchestration routes transactions. Neither one models what a payment actually costs. Here is the honest category map, what each tool genuinely measures, and how to test whether your stack can compute profit after fees, refunds and chargebacks.
Ask a payments team what a subscriber is worth and you get monthly recurring revenue (MRR). Ask what that subscriber cost to collect from, and the room goes quiet. That question spans three processors, and it covers declines, retries, refunds and one chargeback. The gap is not a tooling failure. It is a category boundary nobody has drawn out loud.
This post draws that boundary: which tool measures what, and where the cost side of the ledger stops being anyone's job.
What does payment profitability actually mean?
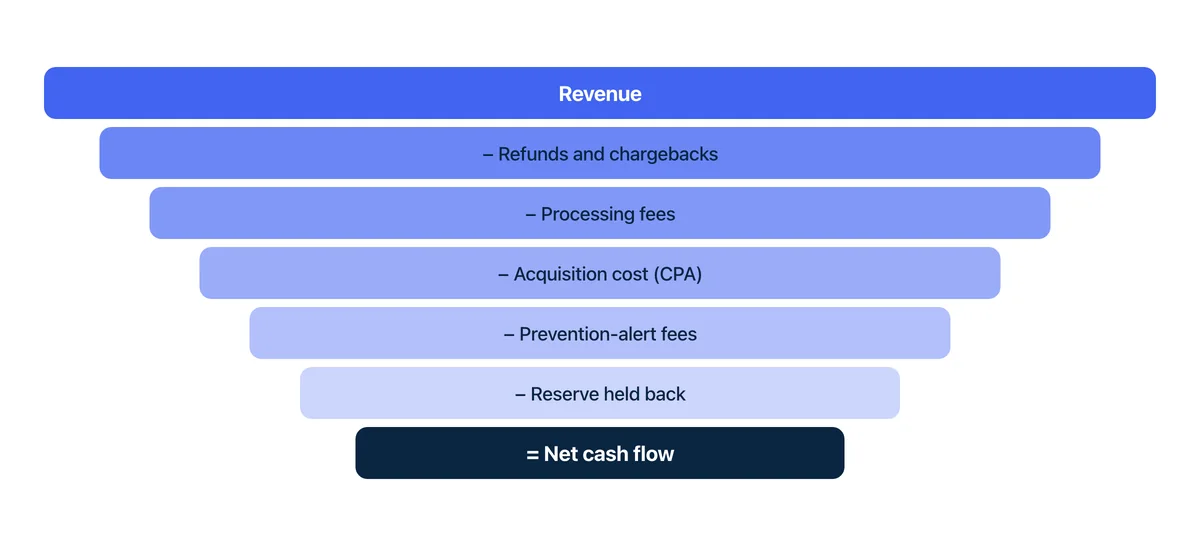
Payment profitability is net revenue after processor fees and everything else the payment stack takes out. That list covers processing fees, network and scheme fees, declines and retry penalties, refunds, chargebacks and dispute fees, currency conversion (FX), and reserves. You compute it at the transaction level, then roll it up by campaign, cohort, gateway or merchant ID (MID). Revenue metrics stop at the first line.
Merchants never see the underlying cost, and that is what makes this hard. Visa states plainly that merchants do not pay interchange directly. They pay a bundled merchant discount to their acquirer, which mixes interchange with every other service the acquirer sells. You cannot read your true cost per transaction off a rate table. You have to read it off your own settlement data, and every processor writes that data differently.
Interchange is also the largest and most variable line. It typically accounts for 70 to 90 percent of the total card fee. A single blended percentage collapses exactly that part into invisibility. Two identical $50 card-not-present debit charges can run 1.65% + $0.15 on an exempt check card. The same charge on a regulated card runs 0.05% + $0.21. A billing system sees $50 in both cases.
Why can't my subscription analytics tool answer this?
Subscription payment analytics tools measure revenue movement read from a billing system, by design. MRR, annual recurring revenue (ARR), churn, average revenue per user (ARPU) and gross lifetime value (LTV) are revenue metrics. They tell you what customers were billed and whether they stayed. None of them carries a cost term, and the vendors say so in their own documentation.
Baremetrics is the clearest on this. Its help center states that Baremetrics tracks payment provider fees as their own metric. Those fees are not removed from your MRR, Net Revenue, or any other metric. That is a design choice, not a defect. MRR is a revenue metric by definition. Its Fees metric covers named sources including Shopify, Stripe and the App Store.
ChartMogul is the strongest multi-source option in the category. It connects natively to Stripe, Chargebee, Recurly, Paddle, Braintree and PayPal. An Import API, CSV and Google Sheets cover anything unsupported. ChartMogul does offer a transaction-fee setting, but the default is not to deduct fees. The documented option applies to a specific set of sources: Google Play, Google Sheets, PayPal, third-party and custom sources. If you are on another processor, ask ChartMogul directly whether fee deduction applies to your source.
Even switched on, the deduction is one blended figure subtracted from the invoice total. A $5.00 invoice with a $1.00 transaction fee becomes $4.00. No interchange, scheme-fee, decline-fee or dispute-fee decomposition sits behind it. ChartMogul computes its Refunds chart on gross transaction amounts, and it does not net fees out.
ProfitWell Metrics (Paddle) reports MRR, churn, upgrades and downgrades, customer lifetime value, active customers and revenue per customer. Paddle lists Paddle, Stripe, Chargebee, Braintree, Zuora and Recurly as supported billing systems. One documented case matters. If you use Stripe only as a gateway and manage subscriptions elsewhere, you get Retain and cash flow metrics. You do not get the full Metrics suite.
Why can't payment orchestration answer it either?
Orchestration is a control plane, not a ledger. It decides how transactions are routed, retried and handled across providers. Its analytics follow that job: authorization rates, declines, failure patterns, routing outcomes. That is a performance view, and it is genuinely useful. It is not a profit-and-loss view.
Gr4vy states in its own FAQ that it is a payment orchestration platform and explicitly not a payment service provider (PSP) or processor. It frames its multi-PSP benefit in authorization terms, with a claimed 3%+ lift in authorization rates. Spreedly builds its reporting around success-rate trends by payment method, card brand and gateway, with about a 60-minute lag from transaction to analysis. Primer's Observability advertises authorization rates by PSP, region, payment method and transaction value across 100+ visualizations.
Orchestration is no longer cost-blind. Primer ships a Costs Overview inside Primer Reconciliation. It normalizes interchange, scheme, processor and FX fees into one comparable format across providers, pitched at spotting leakage and benchmarking providers. Coverage limits it. That reconciliation module covers a named, finite processor list, so a merchant on another acquirer sits outside its cost view. Ask Primer directly which PSPs it reconciles and at what fee granularity.
Gr4vy defines least cost routing as automatically sending eligible transactions through the lowest-cost network available. That definition presupposes you already know the cost of each route. The routing layer consumes cost data. It does not produce it. We cover the routing side in depth in payment orchestration and processor performance.
What tools help subscription businesses track payment profitability across multiple processors?
Four categories show up in this search, and they do four different jobs. Subscription analytics reads revenue from billing systems. Orchestration routes transactions, and increasingly reconciles them. Billing platforms hold the multi-gateway configuration. Processor-native reporting itemizes cost down to the individual transaction, but only for its own ledger. Profitability sits across all four.
| Category | Named examples | What it genuinely measures | What to ask the vendor |
|---|---|---|---|
| Subscription analytics | ChartMogul, Baremetrics, ProfitWell (Paddle) | MRR, ARR, churn, ARPU, gross LTV, cohort retention read from billing data | Can metrics be split per processor, and are transaction fees deducted for my source? |
| Payment orchestration | Primer, Spreedly, Gr4vy | Routing, retries, authorization rates by PSP; Primer adds normalized fee data in reconciliation | Which PSPs do you reconcile, and to what fee granularity? |
| Billing platform | Chargebee and peers | Subscription state and multi-gateway configuration in one place | How many gateways and gateway accounts does my plan allow? |
| Processor reporting | Stripe Fees report, Sigma | Fee detail down to the individual transaction, within one processor | Does this roll up across other acquirers, or only my accounts here? |
None of these four is wrong. The gap is that profit after cost, across providers, is not the stated job of any of them.
On multi-source breadth, the verified picture is clear. ChartMogul is strongest, listing Stripe, Chargebee, Recurly, Paddle, Braintree, PayPal and more, plus an Import API for home-grown systems. Baremetrics is Stripe-first, with Chargebee, Braintree and Recurly support, and it frames itself as "Stripe alone or Stripe with friends." ProfitWell reads from whatever billing stack you run, in one click.
Processor-native reporting sets the bar for what good looks like at the cost level. Stripe's Fees report lists every fee taken from your balance, including network fees, and itemizes down to the individual transaction. Sigma exposes a fee-detail table you join to balance transactions. The gap is cross-vendor, not granularity.
What belongs in a real payment P&L?
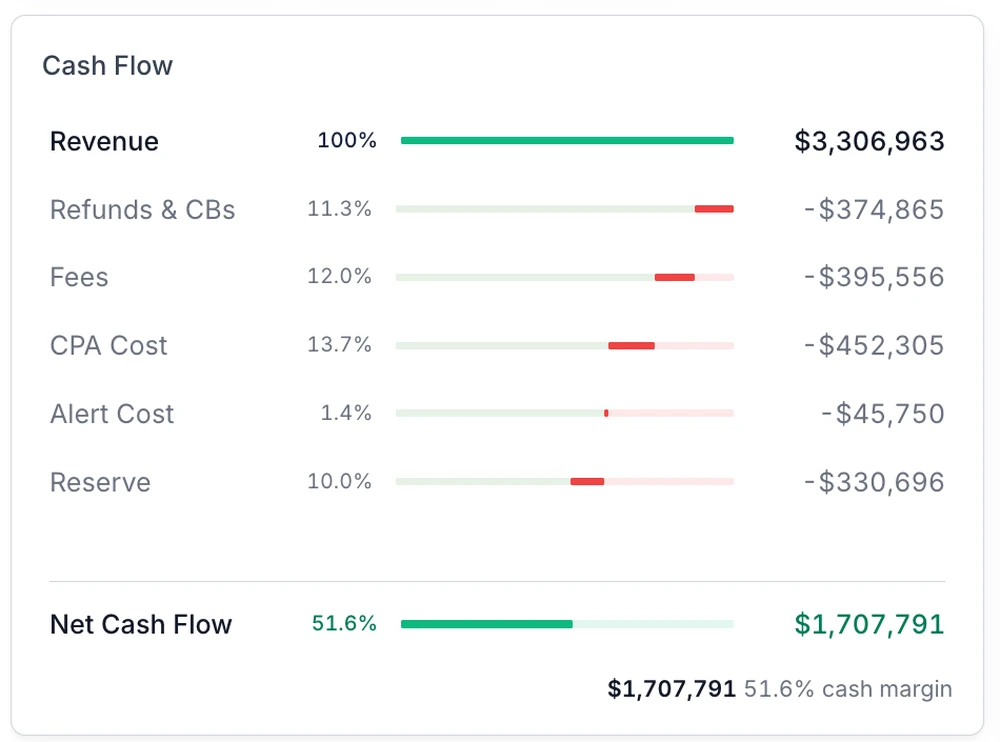
A real payment profit and loss statement (P&L) starts at gross billed revenue. It then subtracts every line the payment stack removes: interchange, scheme fees, processor markup, and per-authorization network fees. It also subtracts decline and retry penalties, refunds (fees not returned), chargebacks and dispute fees, FX, reserves, and acquisition cost. Only then do you have a cash margin.
Three lines get missed most often. First, refunds are asymmetric. Stripe does not return the original processing fee when you refund, and that covers payment processing, Connect and currency conversion fees. A refunded order is net-negative, not net-zero. Second, disputes hit twice. Stripe debits the payment amount plus a dispute fee immediately, and it never returns the dispute received fee, even when you win.
Third, the network fee tail is no longer a rounding error. One industry fee inventory counts 12 distinct Visa fees and 14 Mastercard fees beyond interchange. It notes they averaged about 0.12% of sales a decade ago and can now exceed 0.20%. Networks meter retry logic directly. Mastercard's Excessive Authorizations Fee is $0.50 per excess authorization after 10 declines on the same card in 24 hours, up 5x from $0.10 in 2022. Declined attempts now cost you too. A $0.03 Merchant Advice Code (MAC) fee applies to all declined card-not-present transactions carrying MAC 03 or 21 from January 2026.
Dispute pressure carries its own per-transaction penalty. Visa's Acquirer Monitoring Program (VAMP) sets a merchant "excessive" threshold. It tightened from 2.2% to 1.5% on 1 April 2026 in the US, Canada and EU. Enrolled merchants pay an $8 fee per fraudulent or disputed transaction. Acquirer-side thresholds of 0.5% and 0.7% began enforcement on 1 January 2026. That is why acquirers now push dispute pressure onto merchants.
Involuntary churn is a payment cost wearing a retention costume. Recurly's July 2026 benchmark shows 3.60% overall churn, split into 2.34% voluntary and 1.25% involuntary. Payment failure therefore causes about a third of all churn. We unpack that line in detail in our guide to involuntary churn. We cover the approval-rate side in MID health and approval rates.
Cohort profit or period cashflow: which one are you looking at?
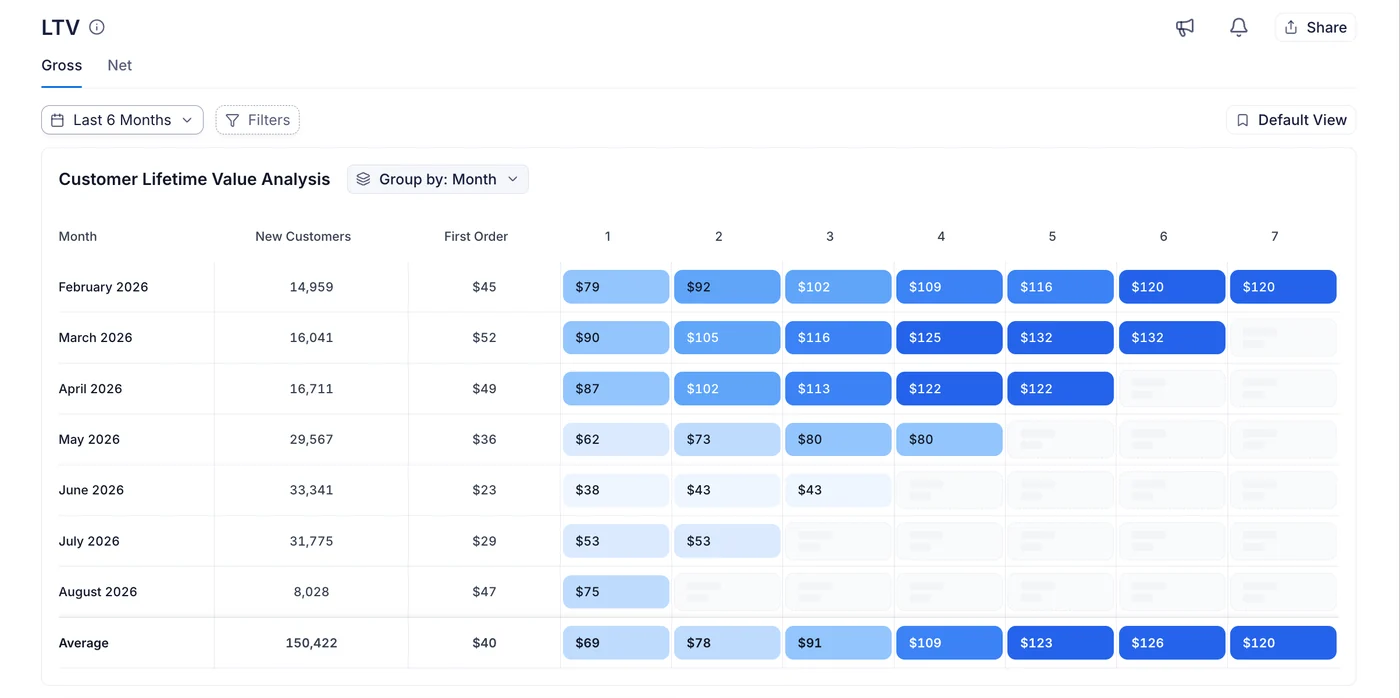
Both are right, for different questions. Cohort profit attributes every cost back to the acquisition or trial date. It answers "was this campaign worth running", which is what cohort LTV after payment costs actually measures. Period cashflow attributes costs to the date the money moved. It answers "what did we actually net this month". Teams argue because they quote different numbers at each other. If you want true profitability per campaign after fees and chargebacks, the cohort view is the one to ask for.
The gap between them is structural, not sloppy. Under GAAP, the US accounting standard, you recognize revenue when you realize and earn it. That moment can fall earlier or later than the payment. In Stripe's revenue recognition ledger the Cash account explicitly excludes fees and payouts. So a cash-basis revenue view and your processing cost live in different accounts. Fees hit as an expense debited against cash, separate from the revenue line.
Timing makes it worse. Cardholders typically get 120 days to open a dispute, and local methods such as Klarna and PayPal typically allow up to 180. Once one opens, merchants get 7 to 21 days to respond, and the issuer takes 60 to 75 days to decide. So a cohort's true profit is not knowable until roughly a quarter after its last chargeback lands.
Even inside one processor, the reporting date changes the answer. Stripe's Balance report uses balance-change date, and the Payout reconciliation report uses payout-available date. Stripe's own worked example shows a 3rd-to-5th window capturing $150 of activity in one report and $60 of payouts in the other. The transactions are the same, and the months differ. Our profitability analysis guide works through picking a lens and sticking to it.
How do I check whether my current stack can answer this?
Run seven tests. Each one is a specific question with a yes or no answer. Each maps to a cost line a revenue dashboard cannot see. If you fail three or more, the number you call profitability is a revenue number with some costs guessed at. Every campaign decision you make on it inherits that gap.
- Can you produce cost per successful transaction, decomposed into fees, fraud losses, refunds and chargeback recovery, for a single order?
- Can you split that cost into interchange, scheme fee and processor markup, or only see one blended rate?
- Can you break any metric out by individual processor or MID, or do your sources merge into one combined view?
- Does your refund reporting treat a refunded order as net-negative (fee retained) rather than net-zero?
- Do dispute fees, including the non-refundable received fee on wins, appear against the cohort that generated them?
- Can you see retry and decline fees (excess authorization, MAC, undefined authorization) as their own line, not buried in a blended rate?
- Do you know the reporting date each source uses, so a cohort view and a cashflow view can be reconciled deliberately?
Two practical gotchas apply when you run these. Stripe fee data is not real time. It lands in the Fees report 96 hours after the fee hits your balance, so that source cannot give you same-day cost-per-campaign reporting. Stripe's cross-account fee roll-up works across Stripe accounts inside a Stripe organization. That is a multi-account view, not a multi-processor one.
If several tests fail, the fix is to make the data comparable before you analyze any of it. You map each processor's field names and schemas onto one model. Then you apply identical metric definitions across every provider and slice by card type, region or corridor. Multi-PSP reconciliation breaks by default, because every provider ships its own data model, settlement cycle and fee structure. A refund at one PSP is a reversal at another.
The right unit of measurement is profit per successful transaction, not conversion or cost in isolation. That is Primer's own framing. When an orchestration vendor names profit per successful transaction as the right unit, the gap is well understood. It is still rarely closed.
Frequently Asked Questions
What is payment profitability?
Payment profitability is net revenue after every cost the payment stack removes: interchange, scheme fees, processor markup, decline and retry fees, refunds, chargeback and dispute fees, FX and reserves. It is computed per transaction and rolled up by campaign, cohort or MID. Revenue metrics like MRR stop before any of those lines.
How do you calculate net revenue after payment processing fees?
Start with the settled amount per transaction, then subtract interchange, scheme or assessment fees and processor markup, plus per-authorization network fees. Interchange typically accounts for 70 to 90 percent of the total card fee, so any model that cannot break it out is approximating the single largest cost line.
Can ChartMogul or Baremetrics track multiple payment processors?
Both connect multiple sources, but neither reports per-processor profitability. ChartMogul is the strongest multi-source option, spanning Stripe, Chargebee, Recurly, Paddle, Braintree and PayPal plus an Import API. Baremetrics documents that connected sources are combined and cannot be broken out by individual source in all graphs.
What is the difference between gross LTV and net LTV?
Gross LTV counts revenue only. ChartMogul, for example, computes LTV as average revenue per account divided by a trailing churn rate, with no cost term in the formula. Net LTV subtracts processing fees, refunds, chargebacks and acquisition cost, so a cohort that looks healthy on gross can be underwater on net.
How do subscription businesses track profitability by campaign?
By joining transaction-level cost data to the acquisition source, then holding the cohort open long enough for disputes to resolve. That means normalizing each processor's settlement data first, since cardholders typically get 120 days to open a dispute and a dispute takes 2 to 3 months to resolve.
Does payment orchestration show cost per transaction?
Increasingly, but partially. Orchestration is a routing layer whose analytics focus on authorization rates by PSP. Primer is the exception, shipping a Costs Overview in its reconciliation module that normalizes interchange, scheme, processor and FX fees, scoped to the processors it reconciles. Ask any vendor which PSPs are covered.
What is the best payment analytics platform for merchants running multiple processors?
There is no single winner, because the categories answer different questions. If you need revenue metrics across billing systems, ChartMogul has the broadest connector list. If you need routing and normalized fee data across the processors it reconciles, Primer is the orchestration option with a cost module. If you need profit after fees, refunds and chargebacks split by gateway or MID, that is the measurement layer, and you should test any vendor against the seven questions above rather than trusting a category label.
How do I see true profitability per campaign after fees and chargebacks?
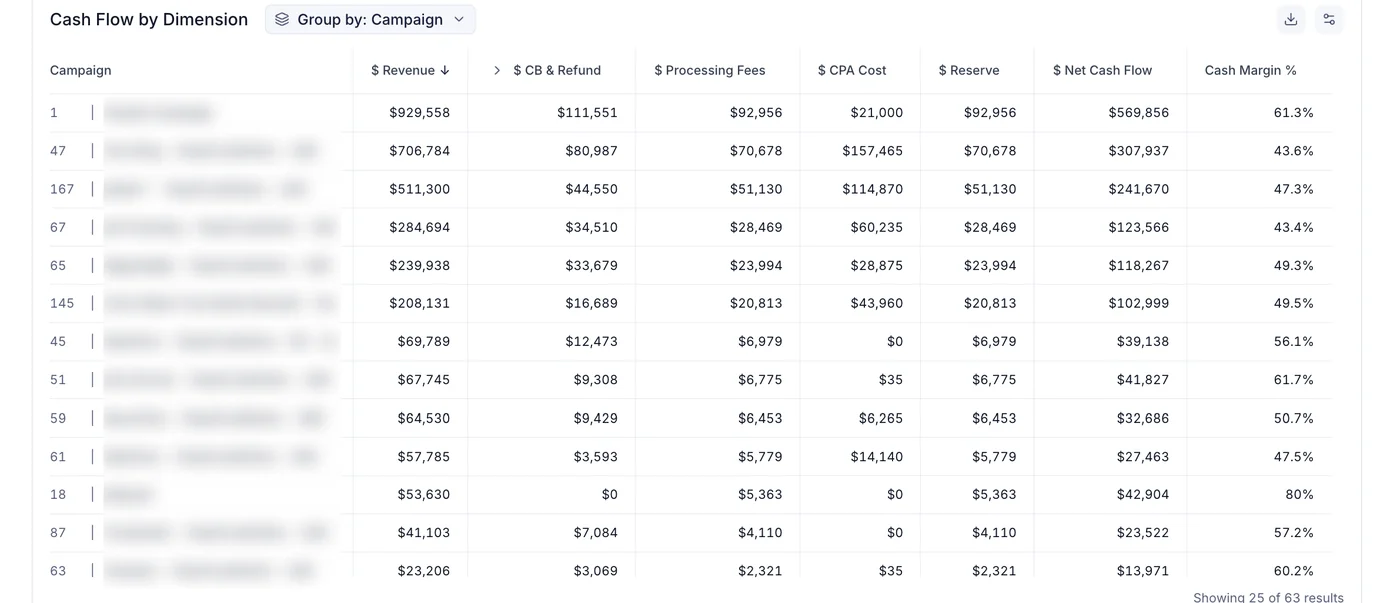
You need transaction-level cost joined to the campaign that acquired the customer. Take settled revenue per order, subtract refunds and chargebacks, processing fees, acquisition cost, any prevention-alert fees and any reserve held back, then attribute the result to the campaign. The output is a cash margin per campaign, which routinely reorders a revenue ranking: the campaign that bills the most is often not the campaign that keeps the most.