What Is Churn Analysis? Definitions, Metrics, and a 7-Step Workflow for 2026
Learn what churn analysis is, how it differs from churn rate, which metrics to track, and a 7-step workflow to find why customers leave and stop it.
What Is the Difference Between Churn Analysis, Churn Rate, and Churn Prediction?
These three terms appear interchangeably across most content on the internet. They are not the same thing, and confusing them produces decisions built on the wrong foundation.
Churn rate is a single backward-looking number. It measures the percentage of customers or revenue lost over a defined period. It tells you the score.
Churn analysis is a process. It uses behavioral data, billing records, support history, and qualitative feedback to explain why churn happened and which segments are most exposed. It reviews the game film.
Churn prediction is a forward-looking model. It applies patterns from historical churn analysis to score current customers by their risk of leaving before they do. It adjusts the playbook before the next match.
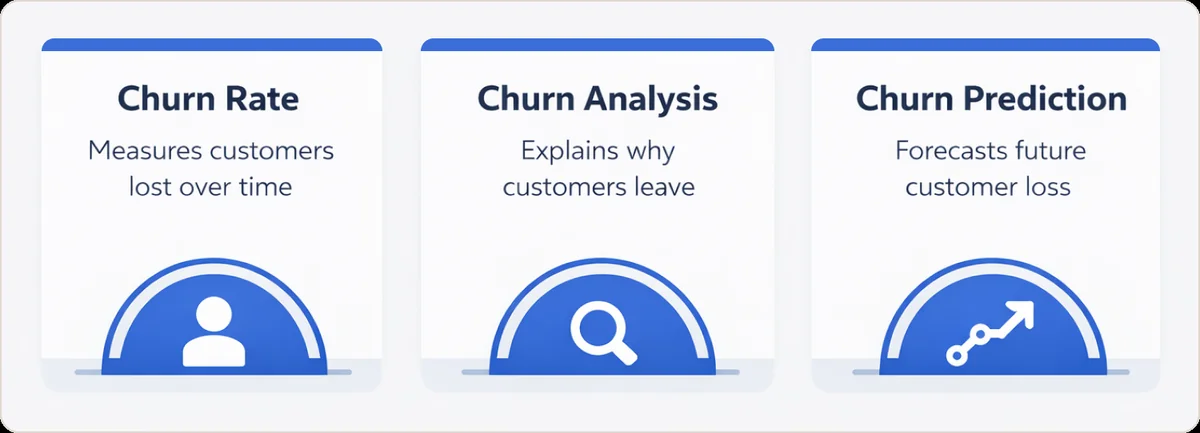
A team tracking only churn rate knows they have a retention problem. A team running proper churn analysis knows which acquisition cohort is churning, at what point in the lifecycle, and what behavioral signal appeared 45 days before cancellation. That is the difference between reporting and operating.
What Exactly Is Churn Analysis and Why Does It Matter?
Churn analysis is the process of collecting, segmenting, and interpreting data about lost customers to understand the root causes of attrition, so a business can intervene before the next cohort follows the same path.
Here is what most guides miss. A SaaS business losing 5% of customers monthly and one losing 5% annually can look identical in a board deck. One is in serious trouble. The other has a manageable problem. The churn rate is the same. The mechanism is completely different. Churn analysis is how you tell them apart.
The financial case is clear. Research by Bain and Company, cited by Harvard Business Review, links a 5% retention improvement to a profit improvement of 25% to 95%. According to Forrester, increasing customer retention rates by 5% increases profits by 25% to 95%. In other words, it can be anywhere from five to 25 times more expensive to acquire a new customer than to keep an existing one. Retention economics compound. Acquisition costs do not.
What Are the Four Types of Churn You Need to Analyze Separately?
Each type of churn has a different cause, shows up differently in your data, and requires a different response. Mixing them into a single churn rate is where most analysis goes wrong.
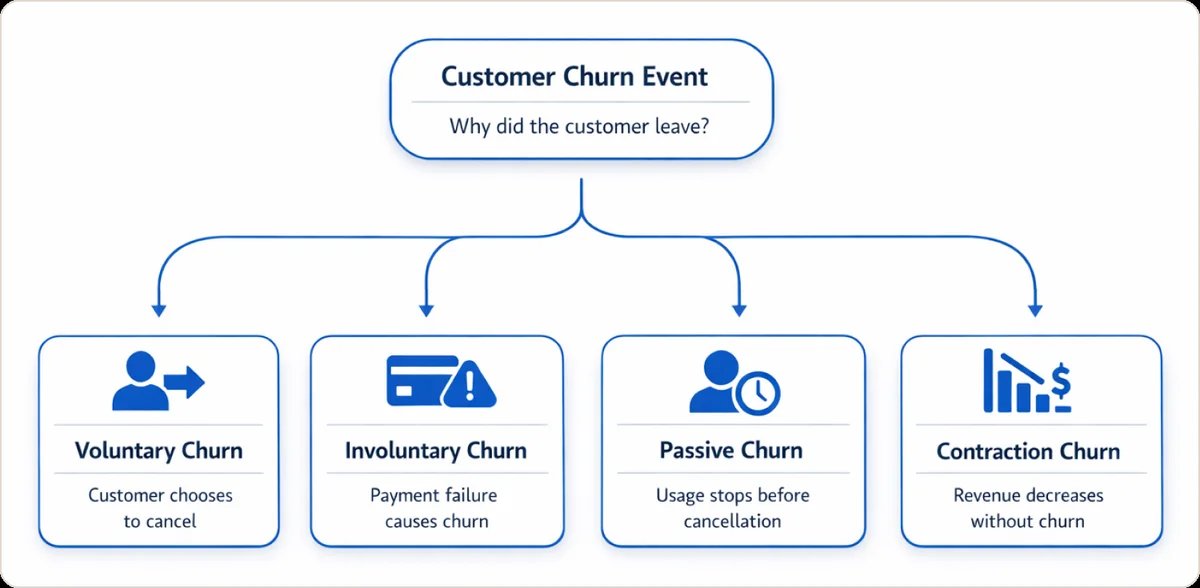
Voluntary churn happens when a customer actively decides to cancel. This is a signal about perceived value, product fit, pricing structure, or competitive displacement. A spike in voluntary churn among a specific segment tells you either that the product broke its promise to that segment or that a competitor made a better one. Look for clusters, not company-wide trends, because the cause almost always lives in a specific cohort.
Involuntary churn happens when a payment fails and the account lapses with no intent to cancel from the customer. According to industry benchmark data from Recurly, involuntary churn accounts for 20% to 40% of total subscriber attrition in subscription businesses. That figure is consistently higher than teams expect when they calculate it for the first time.
The critical point: involuntary churn is the most recoverable type. A customer whose card had expired did not choose to leave. A structured dunning management workflow combined with a card account updater service can recover a significant portion of this revenue before the customer realizes there was a problem. Building a dedicated failed payment recovery process is one of the highest-return retention investments most subscription businesses are not making.
Passive churn (silent churn) is the most dangerous type because it is invisible until it becomes a cancellation. The customer is still paying and still counted as active, but they have stopped using the product. By the time they formally cancel, the relationship has often been over for 60 or 90 days. Catching passive churn requires monitoring inactivity at 30, 60, and 90-day thresholds and triggering re-engagement before the renewal window opens.
Contraction churn is a downgrade. The logo stays, but the customer moves to a lower plan, reducing monthly recurring revenue. A business can show flat or growing customer counts while slowly bleeding MRR through contraction. This only becomes visible when you track revenue churn separately from logo churn.
How Do You Define Churn for Your Specific Business Model?
Before running a single calculation, you need a precise, agreed-upon definition of what "churned" means in your specific business context. The single most common cause of churn analysis failure is that the finance team, the product team, and the customer success team each use a different definition and spend every review arguing about whose numbers are correct instead of discussing causes.
Here is how to define churn by business model:
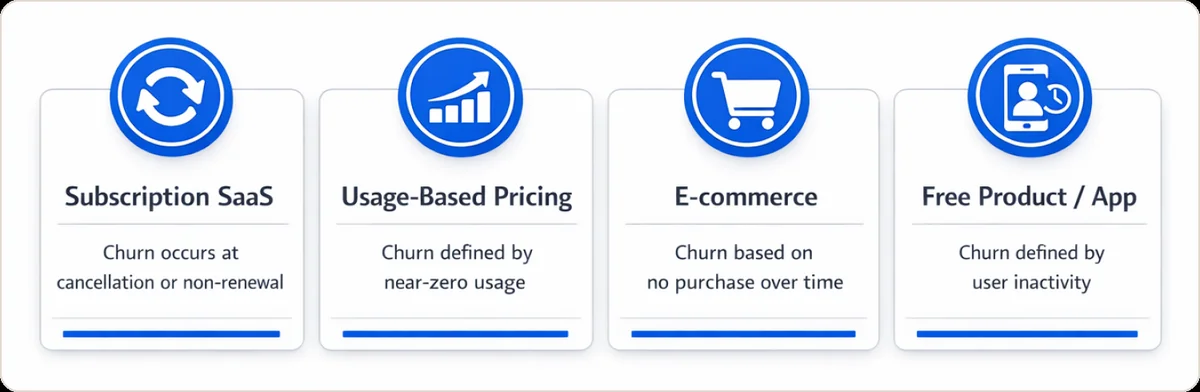
Subscription SaaS: A customer has churned when they cancel or fail to renew at the end of a paid term. Document whether churn is recorded on the cancellation request date or the end of the paid period. Apply this consistently across every system that touches the data.
Concrete example: "Churned customer: any account with subscription_status = 'cancelled' AND cancellation_effective_date within the reporting period. Trial expirations tracked separately and excluded from voluntary churn calculations."
Usage-based pricing: Churn is when usage drops to zero or falls below a minimum meaningful threshold. Define explicitly: is a customer spending $1.50 per month in a usage-based system still active, or effectively churned? The answer depends on the cost to serve and your expansion motion.
E-commerce with repeat purchase intent: There is no formal cancellation event. A customer has churned when they have not purchased within a defined window, typically 60, 90, or 180 days, depending on average category purchase frequency. Calculate the threshold using your own customer purchase cadence data, not a generic rule.
Free product or app: Churn is inactivity. The right window depends on natural usage frequency for your specific product. A daily-use tool and a monthly-use tool need different thresholds.
The practical test: write the definition as a SQL WHERE clause or spreadsheet filter. If you cannot express it that precisely, you have an intention, not a definition.
What Metrics Should You Track in a Churn Rate Analysis?
Four metrics cover the essential picture. Here is what each one measures, when to use it, and where it misleads.
Customer (Logo) Churn Rate: (Customers lost / Customers at start of period) x 100. Use for headcount reporting. The limitation: it treats a $150/month account and a $150,000/year contract identically. If values vary significantly across your base, logo churn alone is misleading.
Revenue Churn Rate (MRR Churn): (MRR lost from cancellations and downgrades / Starting MRR) x 100. Use for any business with meaningful contract value variance. A low logo churn rate combined with a high revenue churn rate means you are retaining your smallest accounts and losing your most valuable ones.
Net Revenue Retention (NRR): (Starting MRR + Expansion - Contraction - Churned MRR) / Starting MRR x 100. An NRR above 100% means the existing customer base is growing in value even after all churn and downgrades. This is the metric investors use to assess subscription health.
Worked example: $500,000 starting MRR. $40,000 expansion. $20,000 contraction. $30,000 churned. NRR = 98%. That business is contracting from its existing base before acquiring a single new customer.
Cohort Retention Rate: The percentage of a defined customer group (by signup month, plan, or acquisition channel) still active after 30, 60, 90, or 180 days. This is the only metric that answers "when do we lose people?" A blended company-wide churn rate can conceal a 2% rate in one segment and a 22% rate in another.
| Metric | What It Measures | Best Used For | When It Misleads |
|---|---|---|---|
| Logo Churn Rate | Customer headcount loss | Board reporting, headcount planning | When contract values vary significantly across the customer base |
| Revenue Churn Rate | MRR impact of cancellations and downgrades | Revenue forecasting, financial health reviews | Does not show expansion from existing customers |
| Net Revenue Retention | Net MRR change across the existing customer base | Investor reporting, growth health assessment | Can mask individual segment problems behind aggregate performance |
| Cohort Retention Rate | Survival rate of a defined customer group over time | Identifying when and where specific groups drop off | Requires clean, consistently defined historical data |
What Does a Churn Analysis Workflow Actually Look Like?
Most teams skip phases one and two and then cannot understand why the analysis does not lead to any decisions. Here is the full process.
Phase 1: Set the specific question. Write a hypothesis, not a general intent. "Why did monthly plan customers acquired through paid social churn at 3x the rate of organic customers in Q3?" is analyzable. "Why are customers leaving?" is not. Without a specific question, analysis produces observations, not decisions.
Phase 2: Build a clean dataset. Pull billing records, product usage events, support tickets, and payment decline data. The most common failure here: cancelled accounts and trial expirations recorded identically in the billing system, inflating voluntary churn counts. Audit before analyzing. If your billing system does not distinguish between a cancellation and a failed-payment lapse, you are measuring two different things as one.
Phase 3: Segment before concluding. Run cohort analysis first. A blended 8% monthly churn rate can hide a 2% rate among annual plan customers and a 22% rate among monthly trial converts. These are different problems requiring completely different solutions.
Phase 4: Identify behavioral leading indicators. Look for signals that appear before the cancellation event: declining login frequency, features used by retained customers but not churned ones, and support ticket spikes in the 30 days before cancellation. These are the signals worth building early-warning systems around.
Phase 5: Validate with qualitative research. Quantitative data shows patterns. Exit interviews explain reasons. Ten to fifteen structured conversations with churned customers per quarter produce more actionable insight than most dashboards. Ask: what was the moment you decided to leave, what did you choose instead, and what would have changed your decision?
Phase 6: Prioritize by revenue impact and confidence. Rank drivers by: how many customers are affected, how much revenue is at risk, and how confident you are that a specific intervention will work. Fix high-revenue, high-confidence problems first.
Phase 7: Define success before launching. Every retention action needs a pre-defined metric. For onboarding changes: a shift in the 30-day cohort retention curve. For involuntary churn recovery: a measurable reduction in failed payment lapse rate. Without this, you cannot distinguish between an intervention that worked and random noise.
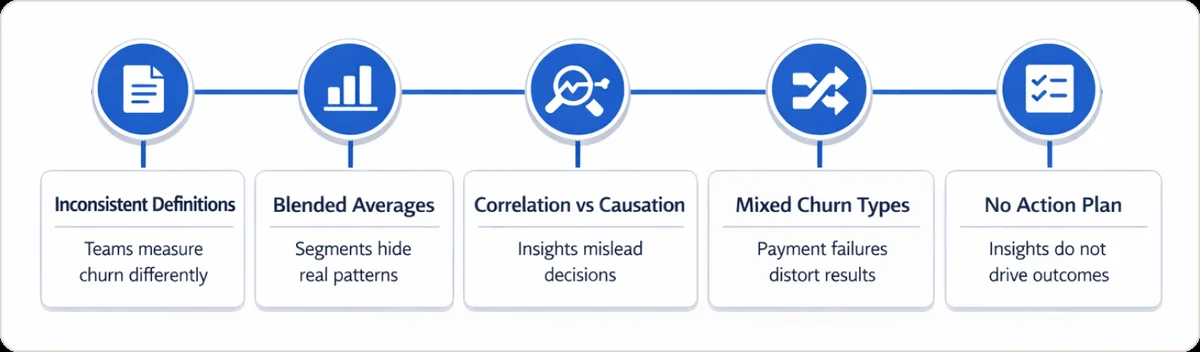
What Are the Most Common Churn Analysis Mistakes?
Inconsistent definitions across teams. When finance, product, and customer success each define "churned" differently, every review becomes a numbers debate instead of a cause discussion. This is fixable in one meeting with one documented definition.
Treating the blended average as the full picture. A company-wide churn rate of 6% can mask a 1% rate in one segment and a 28% rate in another. Always segment before concluding.
Confusing correlation with causation. Customers who log in daily churn less often. That does not prove that increasing login frequency reduces churn. High-engagement customers may simply be a better-fit segment from the start. Correlation identifies investigation targets. It does not confirm mechanisms.
Not separating involuntary churn from voluntary churn. Mixing payment failures into the voluntary churn count inflates the voluntary rate and misdirects resources toward product and onboarding fixes when a billing infrastructure fix would recover the revenue faster. Treating involuntary churn as a separate analytical category, with its own dataset and its own interventions, is the most common structural fix subscription businesses need and the least frequently implemented one.
Building prediction models without action plans. A churn risk score assigned to an account that is owned by no one and triggers no playbook changes nothing.
As Lincoln Murphy, customer success strategist, has written: "Churn happens because customers don't achieve their Desired Outcome with your product. Fixing the path to that outcome eliminates churn." (Sixteen Ventures)
Conclusion: Churn Analysis Is a System, Not a Monthly Report
The shift that separates businesses that reduce churn from businesses that just measure it is this: treating churn analysis as a repeatable diagnostic system rather than a reactive report you run when leadership asks why the number moved.
That system starts with a precise definition, measures across metrics that reflect actual revenue health rather than just logo count, identifies behavioral drivers before they become cancellations, validates causes through direct customer research, and closes the loop with interventions that have pre-defined success metrics.
The businesses that win on retention long-term are not the ones with the most sophisticated dashboards. They are the ones with the clearest definitions, the most consistent process, and the discipline to act before the problem shows up in the headline number.
One area where that discipline pays off faster than most teams expect: separating involuntary churn from voluntary churn before building any retention strategy. A significant share of cancelled accounts in any subscription business are payment failures, not product decisions. A structured failed payment recovery process addresses that directly, without touching onboarding, pricing, or anything else. It is often the fastest revenue recovery available, and the last thing most teams build.
FAQ
What is churn analysis in simple terms?
Churn analysis is the process of examining behavioral, billing, and usage data about customers who have stopped doing business with a company in order to understand why they left and what changes would prevent future attrition.
How is churn analysis different from churn rate?
Churn rate is a single backward-looking metric showing the percentage of customers lost in a period. Churn analysis is the full diagnostic process using multiple data sources to explain the causes, timing, and segment patterns behind that number.
What is customer churn analysis used for?
Customer churn analysis is used to identify at-risk customer segments, determine the root causes of cancellation, prioritize retention investments, and measure whether specific interventions are improving retention over time.
What is passive churn?
Passive churn occurs when a customer stops engaging with a product but does not formally cancel. Passive churn is a leading indicator of future cancellation and is identified by monitoring usage inactivity at 30, 60, and 90-day thresholds.
What is a good churn rate for SaaS businesses?
For B2B SaaS companies serving enterprise customers, an annual logo churn rate of 3% to 7% is generally acceptable. SMB-focused SaaS companies typically see 10% to 15% annually. These benchmarks vary significantly by segment and pricing model. The most useful reference point is a company's own historical baseline tracked consistently over time.
What data is required to run a churn analysis?
A basic churn analysis requires billing or subscription records (start dates, cancellation dates, plan details), product usage events (logins, feature activity, session frequency), and ideally support ticket history. Advanced analysis adds payment decline history, behavioral event streams, and firmographic enrichment data.
What tools are used for churn analysis?
At the foundational level: SQL against a data warehouse, plus spreadsheets for cohort tables. At the intermediate level: a BI tool such as Looker, Tableau, or Metabase. At the advanced level: a dedicated product analytics or customer data platform with cohort and retention modules. The tool matters less than having a consistent definition and a clean dataset.
How often should a company run churn analysis?
Cohort-level retention data should be reviewed monthly. A full diagnostic analysis with qualitative validation and intervention prioritization should run quarterly. Unusual attrition spikes should trigger an ad hoc review immediately rather than waiting for the scheduled cycle.