Payment Analytics: How to Measure True Profit, Not Just Revenue
A working method for payment analytics: measure true profitability across every gateway and stop optimizing for the wrong metrics.
Revenue looks great on a dashboard. Approval rates feel like progress. But neither tells you if you're actually making money.
That's the trap most subscription merchants fall into. They chase top-line growth while profit quietly leaks out the back.
Understanding profitability is the most important thing in subscription e-commerce. Yet most merchants don't measure it correctly.
This guide breaks down how to measure true profitability. You'll learn the views that matter, the costs to track, and the decisions that protect your margins.
What Is Payment Analytics?
Payment analytics is the practice of measuring the full cost and outcome of a payment, not just whether it went through. It connects every post-sale event, refunds, chargebacks, alert fees, processing costs and acquisition cost, back to the original transaction, so margin can be read by campaign, product, affiliate, gateway, BIN or issuing bank.
That is a different question from the one a processor dashboard answers. A gateway report tells you volume and approval rate. It cannot tell you whether the approved volume was worth having.
What Is Payment Gateway Analytics?
Payment gateway analytics is the same measurement applied across several gateways and MIDs rather than inside one processor's dashboard. Each gateway reports only its own traffic, on its own fee schedule, in its own format. Gateway analytics normalises them so approval rates, costs and margin are directly comparable side by side.
The distinction matters as soon as you run more than one MID. A single processor cannot show you that the same BIN approves at one rate on your primary acquirer and a materially different rate on your secondary, because it only ever sees its own half of the traffic. Neither can it net your reserve, chargeback fee and alert cost against the revenue those approvals produced, because those costs sit on different schedules per MID. If you are weighing that setup, our guide to running multiple payment gateways covers the operational side.
One gateway gives you reporting. Several gateways, normalised, give you analytics.
This is also the line between reporting and payment analytics software. A gateway dashboard reports what it processed. Payment data analytics has to normalise several gateways onto one model, then attribute every post-sale cost back to the sale that caused it.
The rest of this guide is the working method: which lens to read your money through, which costs to configure, and which breakdowns actually change a decision.
Why Revenue Alone Misleads You
A $50 sale isn't $50 in profit. It's $50 minus:
- Cost per acquisition (CPA)
- Processing fees
- Reserves held by your processor
- Refunds (customer-requested and fraud-related)
- Chargebacks
- Alert fees
- Product costs
After all deductions, that $50 sale might net you $8. Or negative $12.
The problem? Most merchants never run this math at the granular level. They look at monthly revenue, subtract a few obvious costs, and assume they're profitable.
That assumption is expensive. It's why merchants scale to $5M in revenue only to discover they've lost $400K in margin to traffic they thought was "working."
"Many subscription brands don't collapse from weak demand; they quietly bleed profit through unnoticed revenue leaks until the damage is irreversible." — Demed L'Her, CTO DigitalRoute
Two Views of Your Money: Cashflow vs. Profitability
Before analyzing profit, choose the right lens. There are two ways to evaluate your payment data.
Cashflow View
This groups everything by when it happened.
October refunds show up in October. November chargebacks show in November. You see real-time cash in and cash out.
Use this when:
You need a snapshot. What hit my account this week? What's my current cash position?
Profitability View
This ties every post-sale event back to the original transaction.
A customer buys in October. They refund in November. That refund gets attributed to October's cohort.
Use this when:
You want the real picture. Was October's traffic actually profitable? Did that campaign deliver positive ROI?
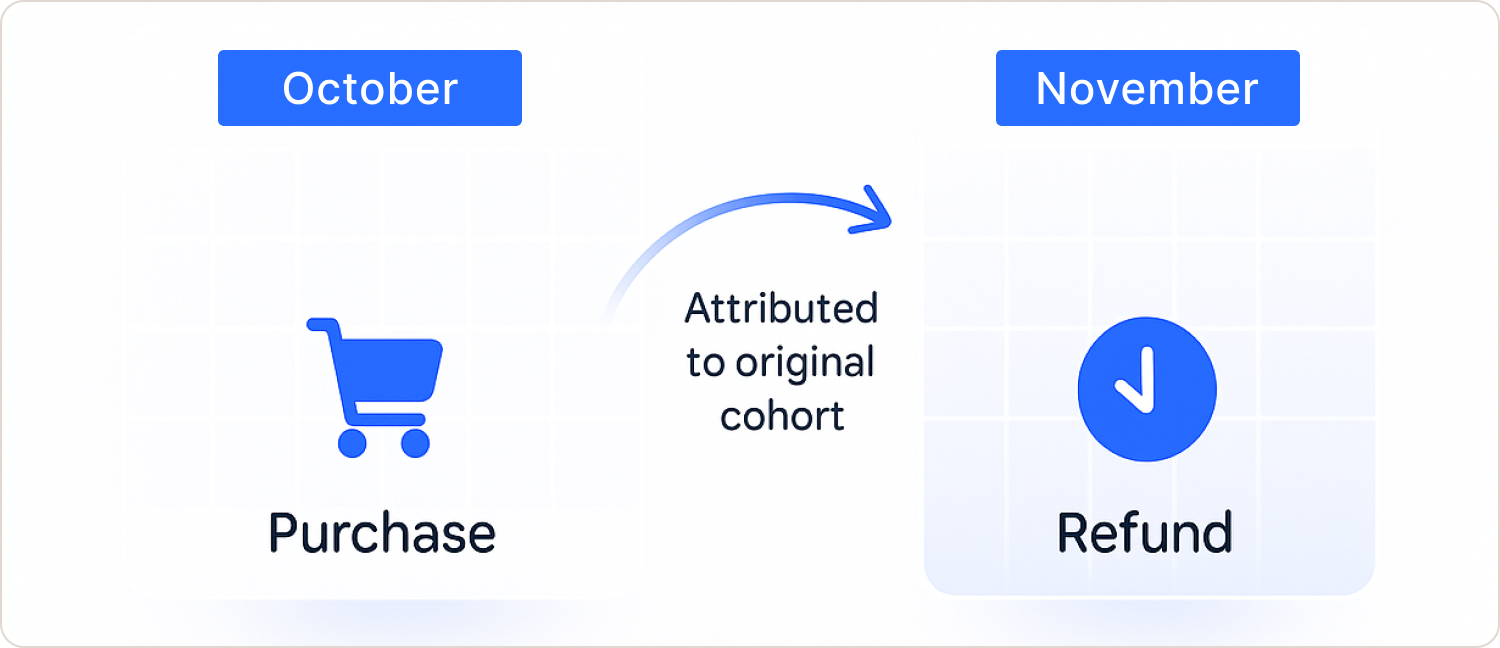
The profitability view shows reality. The cashflow view shows timing.
Most merchants only use cash flow. That's why they can't diagnose what's killing them. They see "revenue up, chargebacks up" and don't connect the dots back to the specific campaigns, affiliates, or BINs responsible.
If you're still relying solely on cashflow reports, you're making decisions with incomplete data. Incomplete data leads to expensive mistakes.
Video Tutorial: See Profitability Analysis in Action
Are you tracking revenue but still not sure if you're actually making money?
In this video, I'll walk you through how to use the Beast Insights Profitability Report to see exactly where your margins are and where they're leaking.
We'll cover:
- 📊 Cashflow View vs Profitability View – and when to use each
- 💰 How to set up your CPA, processing fees, and cost structure
- 📈 CPA priority: Product → Campaign → Default
- 🔍 Breaking down profit by campaign, affiliate, traffic source, and BIN
- ⚡ Why "profitability first, approvals second" changes everything
- 🚫 When to block a BIN vs. when to route smarter
Setting Up Your Cost Structure (The Right Way)
Accurate profitability requires accurate costs. Garbage in, garbage out.
Here's what you need to define and why it matters more than you think.
Default Costs (Apply Globally)
Start with baseline assumptions:
- CPA (cost per acquisition) – What you pay affiliates or ad platforms per sale
- Processing fees – Percentage + fixed fee per transaction
- Reserve percentage – Funds held by your processor
- Chargeback fees – Typically $20-$50 per dispute
- Alert fees – Verifi/Ethoca costs (usually $15-$18 per alert)
- Product costs – COGS or fulfillment expenses
These apply unless you override them.
Product-level costs
override defaults for specific SKUs:
A step-two upsell product doesn't carry CPA. Set it to $0 at the product level. Your profitability math will reflect reality.
Campaign-level costs
override defaults for specific traffic sources:
You run some traffic in-house. That campaign has no CPA. Assign $0 to the campaign. Affiliate-driven campaigns keep their actual CPA.
The priority hierarchy works like this:
- Product-level CPA (if set)
- Campaign-level CPA (if product-level is blank)
- Default CPA (if both are blank)
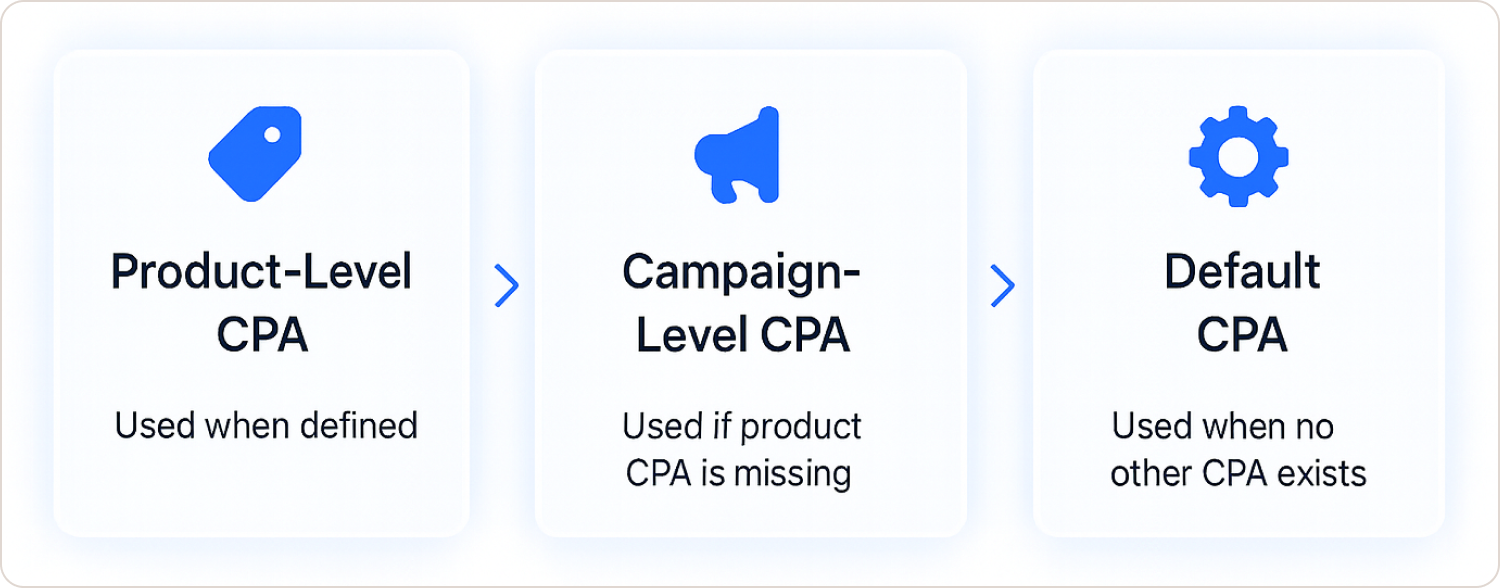
This flexibility matters. A $35 CPA makes sense for one funnel but destroys margins on another. Generic defaults hide that truth.
If you're applying the same CPA to every product and campaign, you're lying to yourself about which parts of your business actually work.
Reading Your Profitability Summary
Once costs are defined, the summary shows your real margins.
Here's what to track:
- Gross revenue — total sales before deductions
- Refunds by customer service — requested cancellations
- Refunds by alerts — pre-dispute refunds via Verifi or Ethoca
- Chargebacks — disputes that hit the networks
- Processing fees — gateway and acquirer costs
- CPA — traffic acquisition costs
- Reserves — funds held by your processor
- Net profit — what's actually left
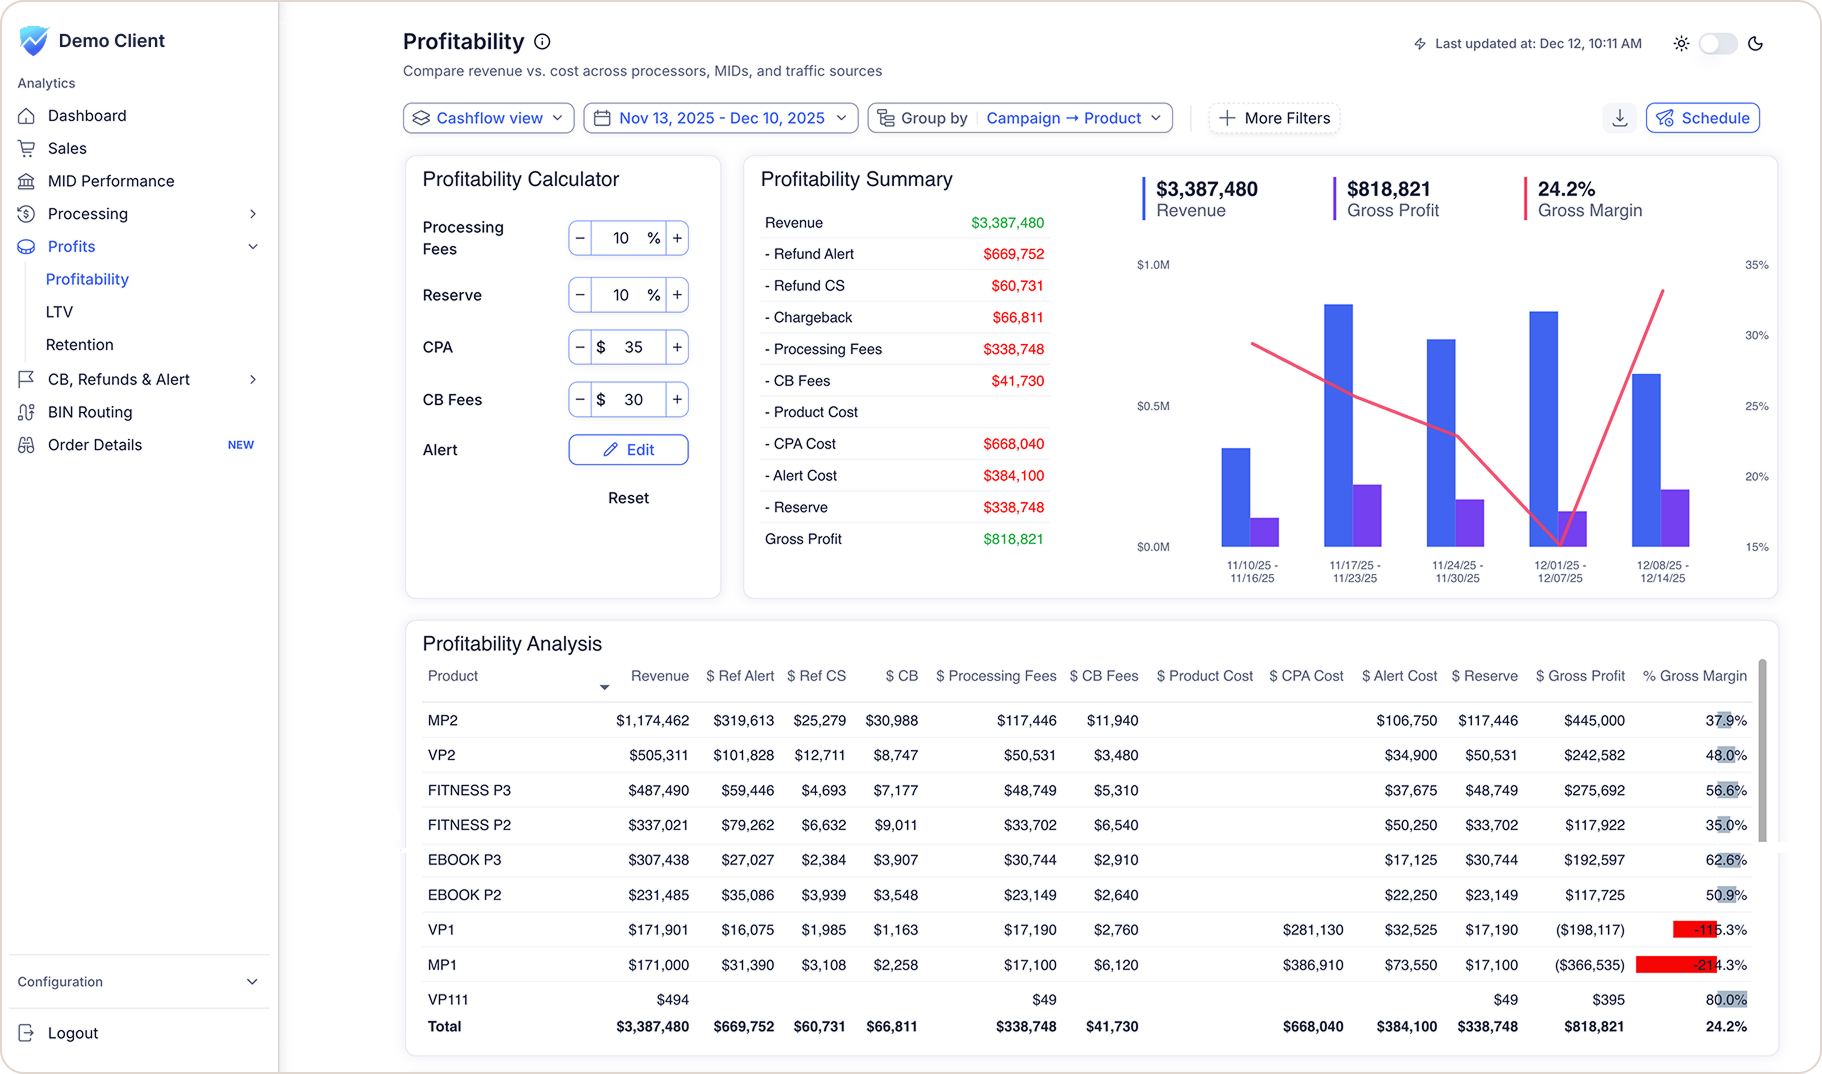
This breakdown reveals where money leaks.
Alerts too high?
Maybe your billing descriptor confuses customers.
CPA eating all margins?
Renegotiate affiliate payouts or kill underperforming traffic.
Refunds spiking?
Investigate product quality or misleading ad copy.
The summary makes problems obvious. But the real insights come from slicing deeper.
Group By: Where the Real Decisions Hide
Aggregate profitability tells you if you're winning. Group-by analysis tells you where and why.
By Campaign
Which campaigns actually make money? Some drive revenue but haemorrhage profit through refunds. Others convert slowly but retain perfectly.
Action:
Group by campaign. Sort by net margin. Kill the losers, even if they "look good" on volume.
By Product
Your flagship product might subsidize losers you didn't know existed.
Action:
Group by product to find which SKUs justify their acquisition cost and which don't.
By Traffic Source
This is where subscription merchants find the biggest insights and the most painful surprises.
Affiliates look identical at the top of the funnel. Same offer, same price, same approval rate. But post-sale behavior varies wildly.
One affiliate sends customers a refund at 18%. Another sends customers who stick with six rebills.
Action:
Group by affiliate ID. Group by sub-affiliate. Find out who delivers real value, not just volume.
An affiliate might send low-approval traffic that converts profitably. Another might send high-approval traffic that churns instantly.
Optimize for profit, not vanity metrics.
This is how top merchants separate signal from noise. They don't chase approval rates. They chase profitable approvals.
By BIN and Bank
This connects profitability to routing decisions.
A specific BIN might approve at 62%. It looks bad. But if those approved customers generate strong LTV with zero disputes, that BIN is gold.
Another BIN approves at 89% but generates massive chargebacks. That BIN destroys profit.
Profitability first. Approval rate second.
That's the mindset top acquirers use. It's how smart merchants protect scale without getting burned.
For more on optimizing approval rates while maintaining profitability, see our guide on improving MID health.
When to Block a BIN (And When Not To)
Blocking BINs feels decisive. It's often the wrong move.
Consider blocking when:
- The BIN has high disputes AND a negative margin
- No routing adjustment improves outcomes
- The volume is low and not tied to a key affiliate
Avoid blocking when:
- The BIN brings significant volume
- A key affiliate relies on that traffic
- Approved transactions are profitable despite low approval rates
Low approval doesn't mean bad traffic. It means the gateway or acquirer isn't optimal for that card type.
Try rerouting first. Adjust front-end pricing. Blocking should be the last resort.
Some BINs look terrible but become profitable with the right gateway. Others look fine, but drain money once you run the full P&L.
Data tells you which is which. Without profitability visibility, you're guessing.
Learn more about strategic payment routing decisions here.
Trend Monitoring: Catch Problems Early
Profitability isn't static. Costs shift. Traffic quality changes. Processor behavior evolves.
Monitor trends by week, by day, by month.
Watch for:
- Chargeback spikes — Signals fraud or traffic quality issues
- Rising refund rates — Signals product or billing problems
- Alert cost increases — Signals descriptor confusion
- Margin compression — Signals CPA or processing cost creep
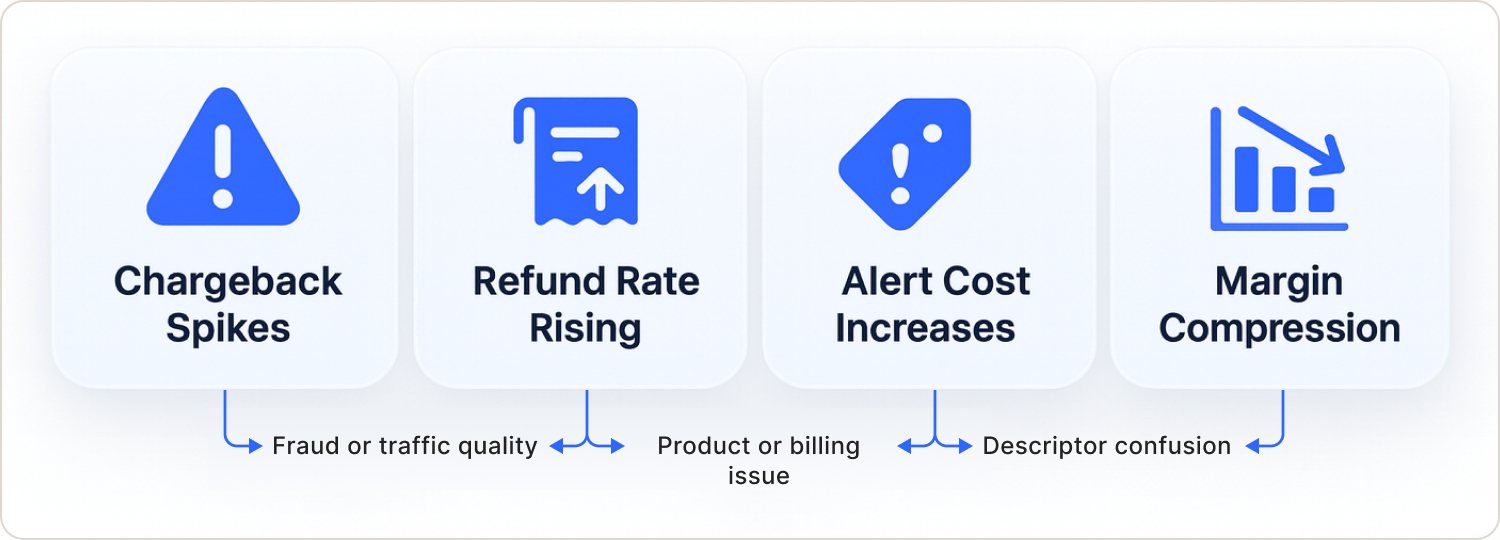
Catching a 2% margin drop in week one costs less than discovering it in month three.
Early detection is everything. That's why weekly profitability reviews aren't optional; they're survival.
If your chargeback rate jumps from 0.8% to 1.2%, don't wait for your processor to notice. Investigate immediately. Was it a specific campaign? A new affiliate? A BIN that suddenly went sideways?
For help diagnosing sudden approval rate changes, check out our 5-step diagnostic method.
Implementation Checklist
Ready to measure profitability properly? Start here:
- Define default costs — CPA, processing fees, reserves, chargeback fees, alert fees
- Set product-level exceptions — upsells, bundles, zero-CPA items
- Set campaign-level exceptions — in-house traffic, variable affiliate payouts
- Switch to profitability view — stop relying on cashflow-only analysis
- Build group-by reports — campaign, product, affiliate, BIN
- Review weekly — catch margin shifts before they compound
This framework transforms how you evaluate performance.
Revenue means nothing without profit. Approval rates mean nothing without retention. Traffic means nothing without LTV.
The Bottom Line
Understanding profitability is foundational.
Every routing decision, every affiliate partnership, every product launch should tie back to margin impact.
Most merchants lack visibility. They optimize for metrics that look good but don't pay the bills. They scale revenue while bleeding profit. They hit $5M in sales and wonder why their bank account is empty.
The merchants who win? They connect every transaction to its true cost. They know which affiliates deliver value. They know which BINs justify their approval rates. They know exactly where profit leaks and how to stop it.
If you're processing payments without this visibility, you're flying blind.
Platforms like Beast Insights help subscription brands connect payment data across gateways, reveal true profitability by cohort, and benchmark against 50+ brands in similar verticals. The goal isn't more dashboards. It's clarity that drives better decisions.
Start with the framework above. Measure what actually matters. Protect your margins.
Frequently Asked Questions
What is payment analytics?
Payment analytics measures what happens to a payment after checkout: approval and decline behaviour, processing fees, refunds, chargebacks and alert costs, each attributed back to the original transaction. It answers what you kept, where revenue reporting only answers what you billed.
What is payment gateway analytics?
Payment gateway analytics applies that same measurement across several gateways and MIDs instead of inside a single processor dashboard. It normalises different fee schedules and report formats so approval rates, costs and margin can be compared side by side.
What is the difference between payment analytics and payment gateway analytics?
They are the same discipline at different scopes. Payment analytics is the general practice of measuring post-checkout payment performance and cost. Payment gateway analytics specifically means doing it across several gateways or MIDs, where each reports separately and the numbers do not line up by default.
What should payment analytics software actually do?
Three things a processor dashboard cannot. Normalise several gateways onto one fee and status model, attribute post-sale costs back to the transaction that caused them, and break the result down by campaign, product, affiliate, MID, BIN and issuer. Payment data analytics that stops at volume and approval rate is reporting, not analytics.
What belongs on a payment analytics dashboard?
Net margin per cohort, not just revenue. Approval rate split by gateway and issuer rather than one blended number. Refund, chargeback and alert cost attributed to the original sale. And a trend line on each, because a two point margin drop is only visible against last week.
What is Profitability Analysis?
Profitability analysis measures true net margins by tracking all transaction costs, including CPA, processing fees, refunds, chargebacks, and alerts against revenue to determine actual profit per sale, campaign, or customer cohort.
How is Profitability Different from Revenue?
Revenue shows gross sales before deductions. Profitability subtracts all costs (acquisition, processing, disputes, alerts, reserves) to reveal what you actually keep. Many high-revenue businesses lose money because they don't track profitability.
What is Cashflow View vs Profitability View?
Cashflow views groups transactions by when events occurred (October refunds in October). Profitability view ties all post-sale events back to the original transaction date, showing true cohort performance regardless of when costs hit your account.
How Do I Calculate Net Profit per Transaction?
Net Profit = Gross Revenue - CPA - Processing Fees - Refunds - Chargebacks - Chargeback Fees - Alert Fees - Reserves - Product Costs. This reveals your actual margin after all deductions.
What is CPA Priority Hierarchy?
CPA priority works as: Product-level CPA (highest priority) → Campaign-level CPA → Default CPA (lowest priority). This prevents one-size-fits-all cost assumptions from hiding which products or campaigns are actually profitable.
When Should I Block a BIN?
Block BINs only when they show high disputes AND negative margins, no routing adjustment helps, and volume is low. Avoid blocking high-volume BINs tied to key affiliates, even with low approval rates, if approved transactions remain profitable.
How Often Should I Monitor Profitability?
Review profitability weekly to catch margin shifts early. Monitor trends daily for high-volume operations. Catching a 2% margin drop in week one prevents months of compounding losses.
Where Can I Get Profitability Analytics?
Platforms like Beast Insights provide profitability reporting across multiple payment processors, with cohort analysis, campaign grouping, and affiliate-level margin visibility for subscription and card-not-present merchants.