Payment Decline Statistics 2026: Approval Rate Benchmarks by Segment
What approval rate is normal for online and subscription payments, why cross-border runs lower, what false declines cost, and which levers actually lift approvals. Every number on this page is attributed to a verified source.
This page collects the most reliable published benchmarks on card approval and decline rates: what is normal for each segment, what false declines cost, and how much the known levers move the number. Every figure links to its source. Last updated September 2026.
| Statistic | Figure | Source |
|---|---|---|
| Domestic recurring approval rate, typical | 85 to 90% | Solidgate |
| Domestic recurring, well optimized | 92 to 95% | Solidgate |
| Cross-border recurring approval rate | 72 to 80% | Solidgate |
| Cross-border with local acquiring | 82 to 88% | Solidgate |
| Local vs international acquiring | 70 to 90% vs 30 to 50% | EBANX |
| Approval spread across acquirers, same BIN | 10 to 25 points | Payneteasy |
| Recurring transactions declined | ~15% | Visa/Mastercard data, via Chargebacks911 |
| False decline cost to US businesses | ~$300B per year | PYMNTS |
| Approval lift from smarter routing | 10 to 15% | Worldpay |
Every figure is linked to its source in the sections below.
What is a normal approval rate?
There is no single average worth quoting. Approval rates only mean something once you name the segment, because the spread between segments is wider than the spread between good and bad merchants inside one. The most useful published bands come from Solidgate benchmarks: domestic recurring card traffic typically approves at 85 to 90%, well-optimized programs reach 92 to 95%, cross-border recurring runs 72 to 80%, and cross-border traffic processed through local acquiring lands at 82 to 88%.
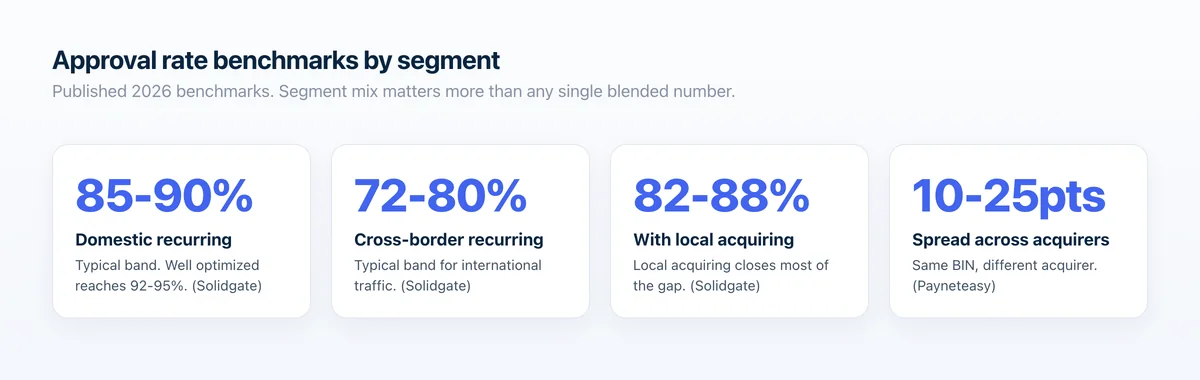
Geography is the biggest single divider. EBANX puts local acquiring at 70 to 90% authorization against 30 to 50% for international cross-border processing of the same demand. And even within one market, Payneteasy reports approval rates varying by 10 to 25 percentage points across acquirers for the same BIN. If your blended number looks low, the first question is what mix of these segments you are actually running.
How often are card payments declined?
- For recurring billing, approximately 15% of transactions are declined, per Visa and Mastercard data cited by Chargebacks911.
- The largest single cause is insufficient funds, at 44.4% of issuer declines on card-not-present transactions, per Ethoca research.
- Credentials age fast enough to matter: 33 to 40% of cards are reissued in a given year, per Stripe, and Visa reports that 30% of card accounts in an account updater portfolio change number, change expiration date or close every year, per its Account Updater documentation.
What those failures cost, and how much of the loss is recoverable, has its own page: our failed payment statistics covers churn impact and recovery benchmarks in the same sourced format, and the churn side has its own benchmarks on involuntary churn statistics. For the wider picture, from card fees to processor outages, see our payment processing statistics.
How big is the false decline problem?
A false decline is a legitimate customer refused by an over-cautious risk decision. Declined transactions cost US businesses approximately $300 billion in lost revenue annually, per PYMNTS. Merchants lose about 13 times more to false declines than to actual fraud, per Javelin Strategy, and up to 40% of falsely declined customers abandon the brand permanently, per Radial. The practical reading: a conservative fraud setting is not free. It quietly trades real revenue for the appearance of safety.
What lifts approval rates?
These are the published, attributable lifts. All of them are vendor or industry reported, all depend on your segment mix, and none is guaranteed.
| Lever | Reported effect | Source |
|---|---|---|
| Routing each payment to the best provider | 10 to 15% approval lift | Worldpay |
| Routing first charges across existing merchant accounts | 57.1% to 68.1% first-charge approval, one account | Beast Insights |
| Cascade retry on a second provider | 8 to 15% of declined volume recovered | Slicker |
| Account updater on stored cards | Prevents 20 to 40% of credential declines | Spreedly |
| Network tokens | +4% authorization rate | IXOPAY |
| Well-implemented 3DS2 | +1 to 3% authorization rate | Inyo |
| One well-timed retry | Failure rate 2.9% down to 1.6% | GoCardless |
Sources: Worldpay, Slicker, Spreedly, IXOPAY, Inyo, GoCardless Payment Success Index, and the Beast Insights case study for the measured account.
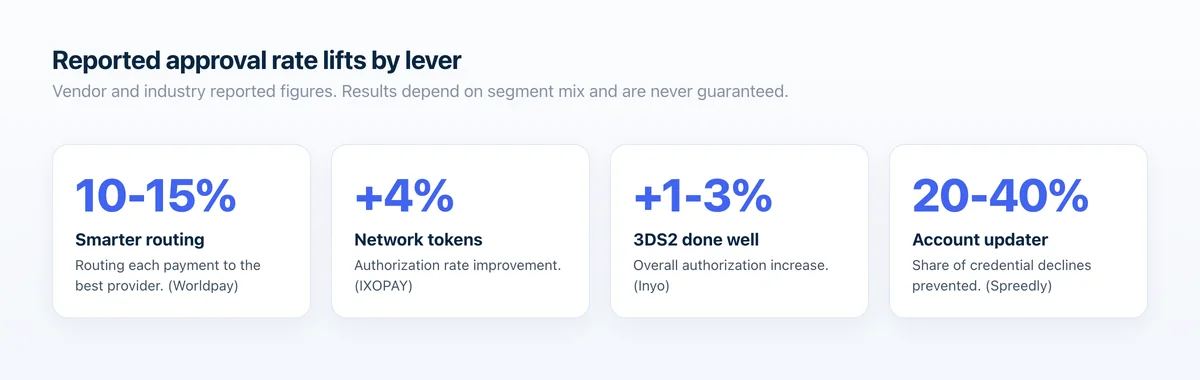
Why even small lifts matter: a 1% approval improvement at $10 million in monthly volume is $100,000 in recovered revenue every month, and PaymentsJournal, citing ACI research, found roughly 40% of merchants who adopted multi-acquirer setups saw acceptance improvements averaging around 1%. The retry playbook, including the network caps that limit it, is in our payment retry strategies guide; the credential side is in our card account updater breakdown; and measured, per-segment routing is what Beast payment routing is built for.
How to measure your own rate
Before comparing yourself to any benchmark, settle the denominator. Three legitimate versions of the same metric circulate: first-attempt rate, raw rate and deduplicated rate. As Stripe documentation lays out, a purchase that failed twice and then succeeded scores 33.3% on a raw rate and 100% on a deduplicated rate. Any program that retries at all depresses its own raw number, so a benchmark comparison using mismatched denominators is noise. Compare like with like, segment before you judge, and if the number moved recently, our guide to diagnosing an approval rate drop walks through the usual causes in order of likelihood.
Frequently asked questions
What is the average card approval rate for online payments?
There is no meaningful single average, because segments differ more than merchants do. Solidgate benchmarks put domestic recurring traffic at 85 to 90% typical and cross-border recurring at 72 to 80%. A blended number in between describes no real population, which is why benchmarking starts with naming your segment mix.
What is a good approval rate for subscription rebills?
Per Solidgate benchmarks, well-optimized domestic recurring programs reach 92 to 95%, against 85 to 90% typical. If you are meaningfully below the typical band for your mix of domestic and cross-border traffic, the gap is usually diagnosable: decline codes, credential age, routing and retry timing, in that order.
Why are cross-border approval rates lower?
Issuers approve familiar, local acquiring far more readily. EBANX reports 70 to 90% authorization for local acquiring against 30 to 50% for international cross-border processing, and Solidgate benchmarks show local acquiring lifting cross-border recurring from 72 to 80% typical to 82 to 88%. Much of the cross-border gap is a routing decision, not a customer problem.
How much can payment routing improve approval rates?
Worldpay reports that routing each transaction to the most effective provider typically lifts approval rates by 10 to 15%. The headroom exists because approval rates vary by 10 to 25 percentage points across acquirers for the same BIN, per Payneteasy. Actual results depend on your traffic mix and are never guaranteed.
How Beast can help
Beast measures approval rates the way this page recommends: segmented by issuing bank, BIN, card brand, gateway and merchant ID, with denominators held consistent, so you are always comparing like with like. It then routes each payment to the provider most likely to approve it and attributes the lift so you can see what routing actually changed. Beast is not a payment processor; it sits across the processors you already run. If your blended rate is below the typical band for your mix, Beast payment routing or a free audit is the place to start.